Summary: There are a ton of Google Analytics features, but if you’re just starting out, it pays to use the most important ones first.
If you’re new to web analytics, finding your way around can be quite intimidating. Even if you’re using a standard tool like Google Analytics, there’s so much you CAN do that it can be difficult to determine what you SHOULD do:
- Should you report on the pages with the most visits?
- What about the areas where a disproportionate number of people leave?
- Should bounce rate be your main consideration to find what’s broken, or should you focus on finding conversion points where conversions are not really happening?
There’s a lot to think about, but you can make it easier on yourself by thinking through the initial setup and prioritizing a few critical reports first.
This post assumes that your main web analytics tool is Google Analytics (GA). However, many of the same principles will apply even if you’re using Adobe Analytics, WebTrends, or some other tool.
Setting Up Google Analytics Features
Before actually digging in and reviewing reports, there are a few things you need to learn and do. Treat this section as “kicking the tires” before you go on a trip.
1. Advanced Segments
Advanced segments allow you to “slice” a portion of the traffic and hone in on that group. This is useful for two things:
- For larger reports, this can keep out “invalid” visits, like those coming from within your company, or those coming from robots rather than people
- For specific reports, this allows you to focus on a “group” of people
Think through a few groups of people that you’d want to drill down to. Here are a few groups you can start with:
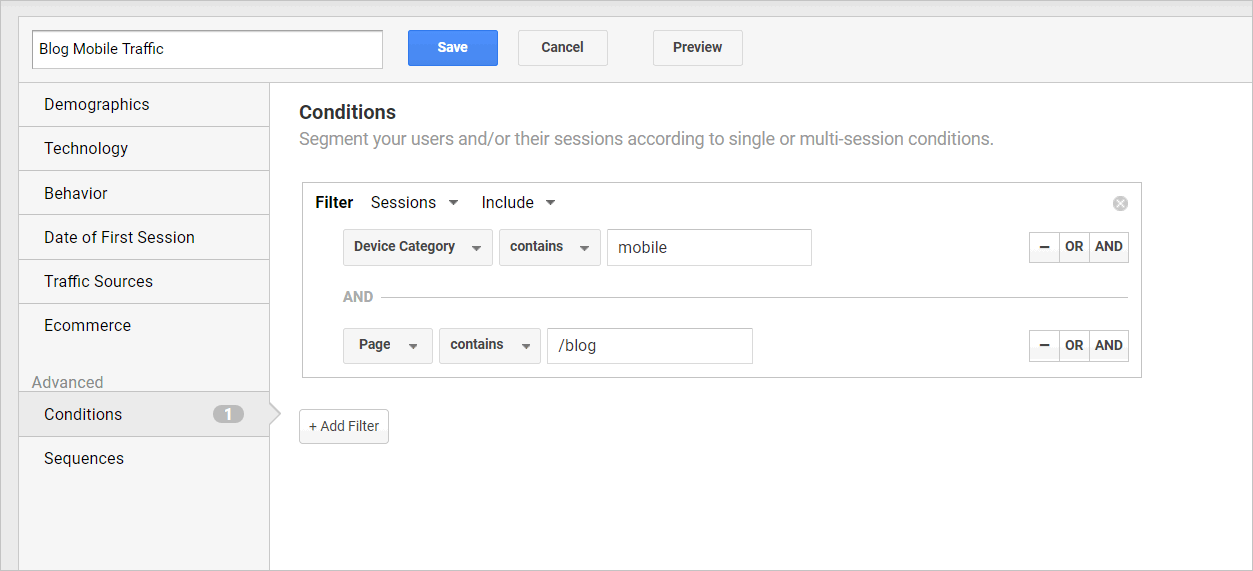
- Mobile device users (Device Category > contains > mobile)
- Visitors who came from banner advertisements on other sites (Source > contains > display)
- Traffic from Google (Source/Medium > contains > google)
We have written about Google Analytics advanced segments before, and you can reference that article if you need a few more ideas about what to build.
2. Custom Alerts
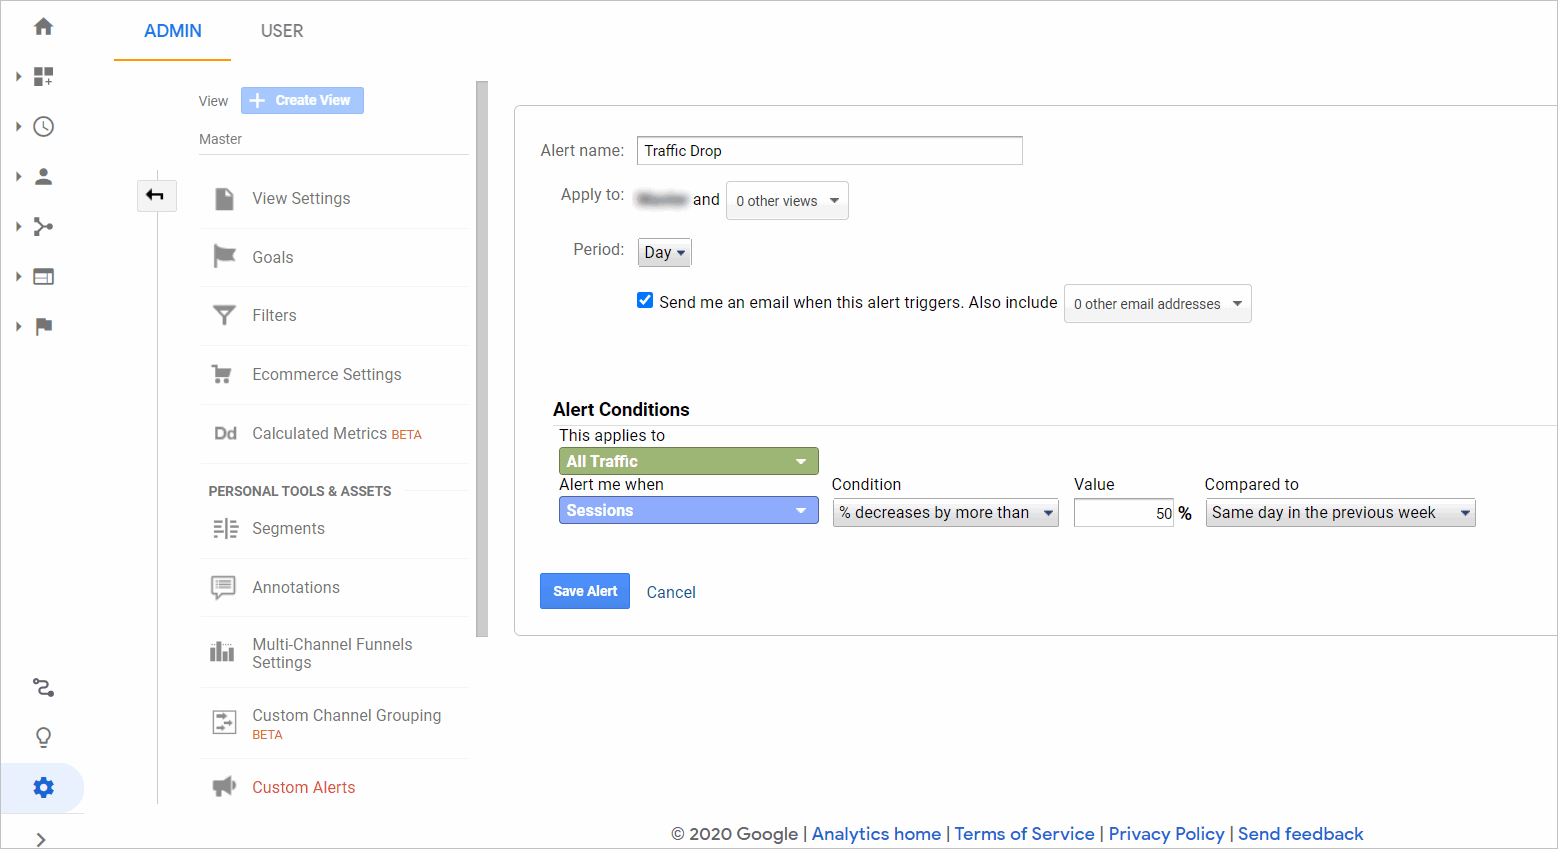
Google Analytics Custom Alerts notify you when something changes about your website even when you’re not actively using GA.
There are a few reasons you’d want to set this up. Here are the most common ones:
- Significant (over 50%) dips in website traffic from the same day last week: this can indicate that something is wrong with your site in general, or Google Analytics isn’t firing and you’re not getting data
- Spikes (over 75%) in 404 errors: this can indicate that there’s something wrong with your content management system (CMS) or parts of your website are broken
Custom Alerts creation is under Customization > Custom Alerts > Manage custom alerts > +NEW ALERT .
You can tweak the thresholds as required, and then select the e-mail that will get notified once the conditions are met.
Note that for traffic dip alerts, some holidays, where you’re likely to get fewer website visitors, will create false positives.
3. Saved Reports
Saved reports allow you to retrieve a combination of a report and a set of advanced segments without manually rebuilding them every time. So if you’ve built, say, a segment for blog traffic on mobile and you’re viewing the report on Behavior> Site Content> All Pages, you can save the combination by clicking on the disk icon labeled save next to export and share at the upper-right side of the page. This way, the next time you want to view it, it’ll just take a few clicks to get there.
When you need it, the saved report will be under Customization> Saved Reports:
Common Things to Look For
Once you have the knowledge to get the basic setup down, you can worry about the specific things you want to look at.
This can vary quite a bit.
Obviously, if you have an e-commerce site, the dollar values you’ve attached to the thank-you page upon a sale will matter more to you than returning visits from educational page views.
You can adjust the items below as required, but these should give you ideas about the types of data you can look at:
1. Mobile Actions
If your visitors use multiple types of devices to get to your site, one of the first things you’ll want to do is isolate what people with smartphones do on your site.
Do they visit your product details more without converting, indicating they are comparing? If so, do you need to build a mobile-compare function to make their lives easier?
You’ll be able to isolate certain behaviors when you look at just mobile device users and what they do.
2. Cart Abandonment Drop-Off Points
If you have a cart experience, you’ll want to see which parts of the cart have the highest exit rates. Those parts may be the leaks in your conversion funnel. If you fix those, you’ll have a disproportionate amount of value delivered to the company.
3. Terms People Use Most
One of the best sources of intent data is what people type into search boxes after they get to your site. For most websites, anywhere from 5% to 20% of the audience will use on-site search.
You can use the on-site search data to improve your site a few ways:
- Look at the terms people type in the most. Check if you need to expose or feature certain products more, or improve your navigation elements so visitors can find those particular items better.
- Look at the terms where people leave before clicking on a result, which could indicate that they were not happy with your results. You can then create featured results for the worst offenders to improve the website experience.
Learn how to leverage on-site search. |
4. High Traffic, High Bounce Areas
If you look at just the areas with high traffic, you won’t necessarily know which of those pages to fix to get the most bang for your buck. You won’t know which pages are broken.
On the other hand, if you look at just the “broken” pages with high bounce rate, those might take you to low traffic pages, and fixing those won’t do a lot for your site, either.
You need to find the broken areas where a lot of visitors go. If you fix those, you’ll bring a ton of value to your site. Fortunately, there’s a handy, hidden feature called weighted sort on Google Analytics that can help get you that data.
Prioritize Tasks Using the Essential Google Analytics Features
There’s a lot you of Google Analytics features that will give online marketers great data sets. However, you need to get organized, think through what will make the most difference for your organization, then prioritize.
It’s best to start getting the basic setup right. Then, you can look at a few reports regularly, like the parts where the funnel leaks and the most broken pages that people use a lot.
If you have both the essential setup and the reports down, you’ll be able to effectively identify the most important marketing tasks.
This post was originally published in May 2018 and has been updated to reflect the interface of Google Analytics in 2020.


