- They don’t compare all the options listed on a page.
- They don’t go through paragraphs of text to take in content.
- They don’t spend a ton of time on any one page.
Instead, they satisfice – they go through one option, do a mental check for any issues, and if the option seems reasonable, they click through and assess if they’re closer to finding what they need.
They then repeat the process until they can get to the meat:
- If they’re on a media site, it’s the news article.
- If they’re on an e-commerce site, it’s the product page.
- If it’s on an industry site, it’s the blog entry that discusses what they’re trying to learn about.
The path to get to what they want, the consumption of the actual page they need, and whether or not they continue to consume content after viewing that page signal how engaged users are. If people drop off after viewing only the navigation page, your site didn’t engage the user.
The stats to view all that are not as popular as organic traffic for search engine optimization or conversion rates for landing page optimization, but under the right context, web user engagement metrics are worth a look.
Let’s get to it.
1. Bounce Rate
Bounces are the people who view only one page, and leave.
Bounce rate is the percentage of people who do that compared to your total traffic – the ones who leave without doing anything:
- If those bounces are for your homepage or your category pages, those are failed visits.
- If those bounces are for your resource articles or blog content, bounces may actually be good – people may have found what they needed and left.
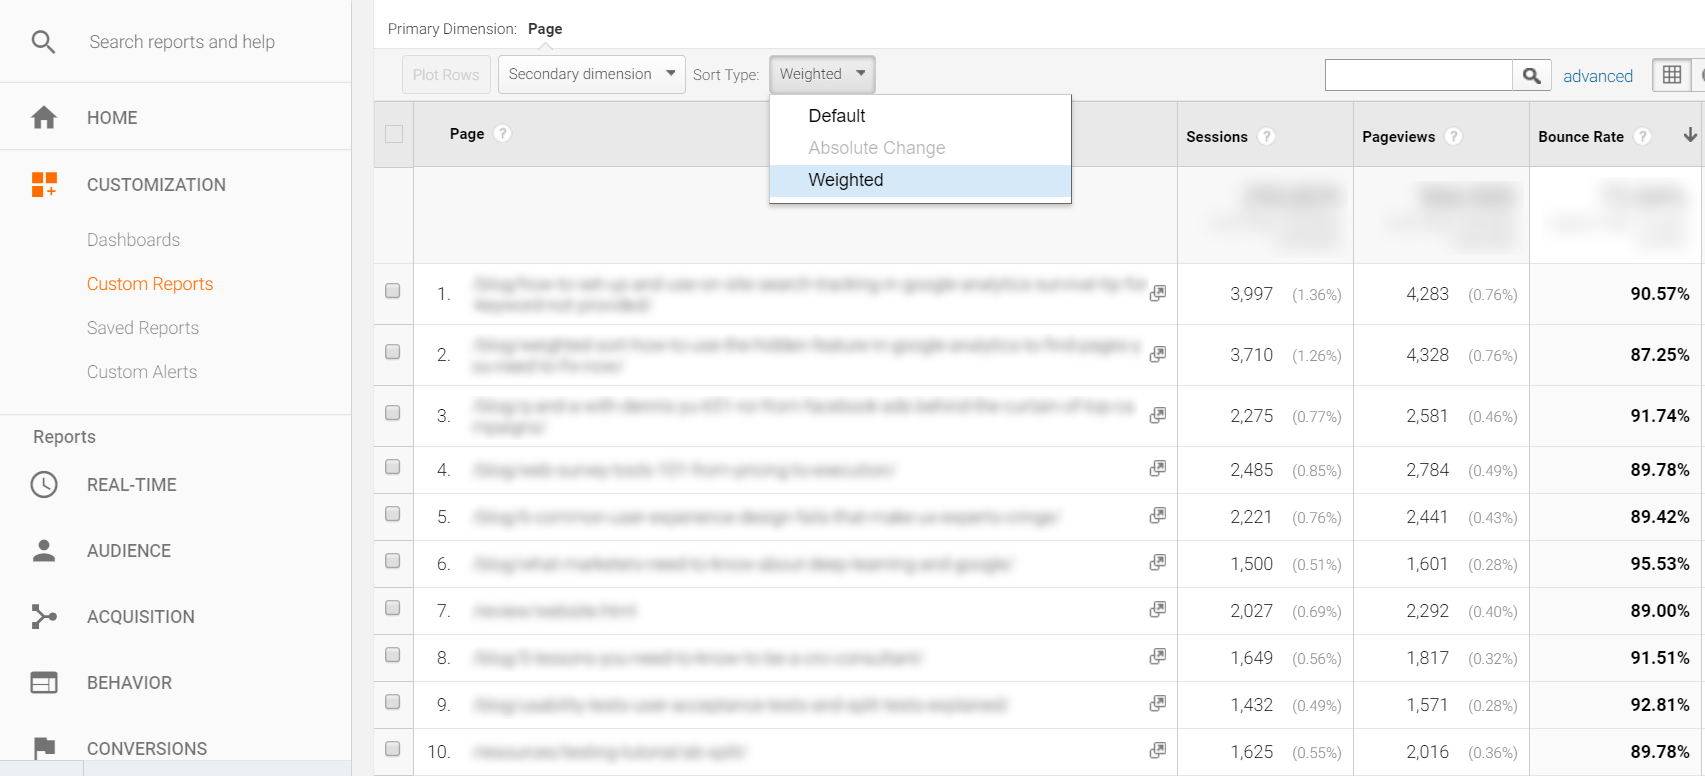
The idea is to minimize bounce rate for the high-traffic pages that are there for navigation. That can be a problem because if you sort by most visited pages, the bounce rates will be all over the place. And if you sort by bounce rate, you’ll likely get a list of low-traffic pages.
To make bounce rate useful, you need to find the high-traffic pages with high bounce rate.
There’s a nifty little feature called weighted sort that can find that intersection. You can get that trouble section by getting a custom report and then changing Sort Type to Weighted:
As a general metric for the entire site, bounce rate is not all that great. If you use it for specific pages, it’s pretty awesome. Use it for diagnostics – the high-bounce navigation pages are prime candidates for testing and improvement.
2. Pages Per Visit
Pages per visit (or pages per session) is even less “general circumstance” than bounce rates. It shows how many pages each user goes through for every session on your website.
Like bounce rate, when used as a general metric on the site, it’s not super helpful. However, when used in a targeted manner, it can help you see useful trends on your website.
The idea is to get monthly stats on certain sections of your website. Pages per visit for the entire site isn’t that useful, but the trending is useful for the sections that are supposed to be sticky, like early stage educational content with related pages.
The other thing you’d probably want to do is segment pages per visit by traffic source. If social traffic is performing poorly, you’re fine – referrals from Twitter or Facebook will not tend to be very sticky. If your Google traffic tends to not stick around, you need to diagnose the section affected.
3. Time On Site
Time on site or average session duration is pretty straightforward – it’s how much time your users spend on the site for one visit.
It is one of the trickiest things to use for engagement monitoring, in large part because of how little you can trust the data.
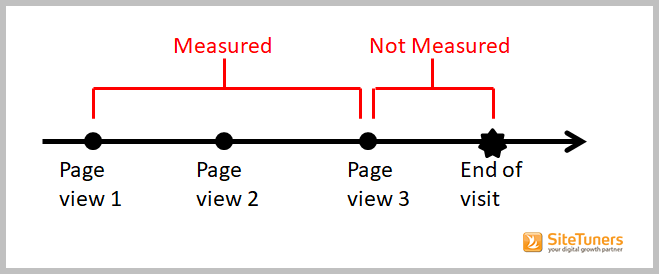
To understand why the data is so dirty, you need to understand how time on pages and time on site is measured. The gap between when pages load is what gets measured. So if a user has 3 page views, and spends some time on the third page, this is what gets measured:
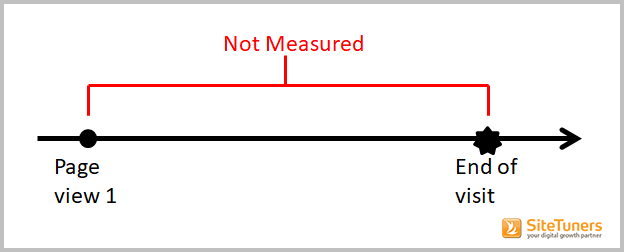
It gets even worse when a user just views one page:
No time will be recorded as spent for that one page view, even if the visitor stays and reads for an hour.
All of this means that you need to use time on site sparingly, and that you only take the data as directional.
That said, for the sticky pages on your site, it’s a good complementary stat for your pages per visit. Report those things together when you’re using this.
4. Exit Percentage
Exit percentage is, well, the percentage of people who exit on a page:
Visitors always have to leave somewhere, so the particular exit percentage on a page isn’t all that interesting – usually. However, it is particularly compelling on two kinds of pages:
Your site’s 404 page
If a person exits from a 404 page, that’s bad news. That means that the elements you’ve added on that page did not help the person recover. If you see a high exit rate there, you need to consider improving your 404 page.
The on-site search page
If people exit from the on site search page, the search results didn’t do anything for them. It might be time to take steps to improve the engine.
How Engaged Are Your Users?
Engagement stats generally aren’t simple to use. Bounce rate, pages per visit, time on site, and exit rate are not going to be super useful when applied to the entire site as a trend. Those stats are useful for more targeted things:
- Bounce rate is useful to diagnose navigation pages.
- Pages per visit and time on site are useful for certain parts of website, like sticky early-stage pages.
- Exit percentage is useful for the 404 page and the on site search page.
If you regularly study how engaged users are for the different parts of your site, you’ll be in a better position to improve your website.
Take your conversions to the next level.Learn how our experts at SiteTuners can help kickstart your conversion rate optimization process or get better results from your CRO efforts. Give us 30 minutes, and we’ll show you a roadmap to your digital growth! |
