 Google Analytics is extremely powerful when you’re familiar with the ins and outs: Advanced Segments, Goals, Alerts, and a range of somewhat hidden functions.
That said, even basic familiarity with the tool can get you pretty far. If you’re trying to get started with Google Analytics, you can do a lot worse than start off with the most useful standard reports.
1. Page Breakdown
Behavior> Site Content> All Pages
If you’re looking to observe the performance of your top pages, and the particular pages that affect the company’s bottom line, this is your starting point.
It’s a straight up listing of the pages with the most views, and you can see bounce rate right there on the report, so you can review which pages are “failing.”
Say you’re looking for a particular page. While you’re on this report, you can use the search bar for the URL you want to take a look at, and get exactly the URL, views, and bounce rate you’re interested in.
It’s a report that a lot of marketers start with, and as you get more advanced, you can add Advanced Segments to the report to make it even more useful:
- If you’re looking to dissect pages that drive early stage visitors, you can add Advanced Segments for content marketing pages or social media visits to this report
- If you’re concerned about the bottom of the funnel, you can add Advanced Segments for eCommerce pages or “Thank you” pages
2. Channel Effectiveness
Acquisition> All Traffic> Channels
As a marketer, you need to know which avenues drive the most traffic to your site, and how many people leave per avenue without clicking on anything.
That’s where this report shines: it doesn’t give you a set of action items to fix the site quite yet, but it does tell you which channels are “broken.”
Once you use the report, you’ll be able to see whether most of your visitors come from search engines, social media referrals, other sites, emails or other avenues. Likewise, you’ll be able to see which ones are performing poorly at getting people to stick around – those channels are the ones you’d want to take the time to improve.
Ready to take Google Analytics to the next level?
3. Referring Source Effectiveness
Acquisition> All Traffic> Source Medium
This is a cousin of the Channel Effectiveness report above, but this goes into a bit more detail. Once you know which general channel needs the most work, you can use this report to drill down to what you need.
With this report applied, you can expand the number of rows, and then conduct a search like “social,” “referrer,” or “organic.” Maybe social media visits are performing just fine, except for Facebook or LinkedIn. Maybe most sites deliver traffic that sticks, but you have a few outliers that don’t get people to engage. This is the report you’ll use to get to the specifics.
Once you’re a little more savvy with Google Analytics, you can add Advanced Segments to this report for just people who you consider early stage visitors (like visitors to your blog or content marketing pages) or just late stage visitors (like shopping carts) and get even more value from the report.
4. Device Breakdown
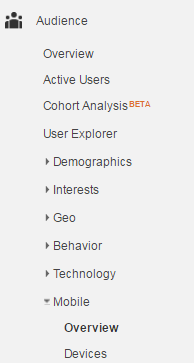
Audience> Mobile> Overview
Some sites are more reliant on mobile than others. It pays to understand how many mobile visitors you have, and whether or not they exceed the number of visitors you get from desktops and laptops.
This report gives you a snapshot of the breakdown between desktops, mobile devices, and tablets. If you look at this at least once a month, you’ll be better equipped to come up with the mobile strategy that fits your needs.
Putting It All Together
You can start with these 4 reports, and they’ll get you pretty far. Every marketer needs to understand the page and device breakdowns, the channel and referring source effectiveness.
That said, once you’ve cut your teeth in standard reports, you’re going to want to progress to the more advanced features. If you’re looking to read up on the more advanced features of Google Analytics, you can read these next:


