Google Analytics is a pretty useful tool, especially when you’re …
- digging around using advanced segments,
- finding pages to fix with Weighted Sort,
- or checking your web site’s goals.
You should spend most of your GA time with those items, and less time producing recurring reports and dashboards, especially when it’s one of those mandatory views and visits by month variety with no actionable metrics.
That said, every now and again, it pays to review month over month or year over year performance. So when you do have to make dashboards, you might as well make actionable dashboards.
What makes a dashboard useful?
Dashboards are useful when they help you see where you can start hunting for improvements.
So a generic dashboard containing just views and visits per month, that may make management feel good or bad, but it’s not specific enough to start hunting for improvements. A dashboard containing traffic sources, however, may help you see that something like organic or social visits have spiked, so you can start digging further. A dashboard containing your bounce rate, especially if you can add advanced segments later, can help you assess engagement over time and check for performing channels.
Do you have any examples?
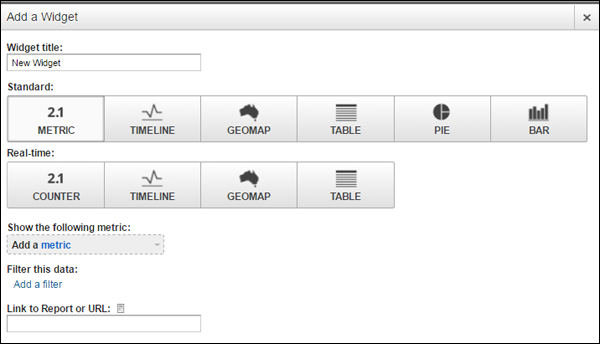
With Google Analytics open, use this link to download our custom dashboard.
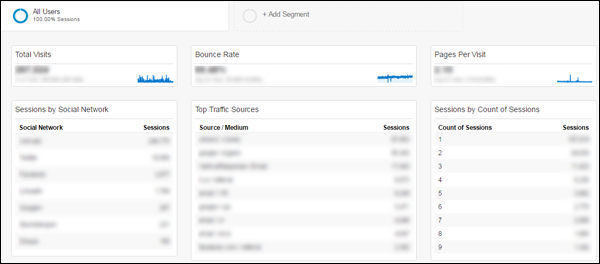
When you have applied it, you will see something like this:
To see why this is actionable, it helps if you’re familiar with the AIDA framework:
- Attention
- Interest
- Desire
- Action
What the report does is hone in on the attention and interest phases, with a smattering of the desire phase.
How does this dashboard track attention?
For attention, you generally want to compare the number of visits coming to your site month over month, as well as the amount of traffic you get from social media (which can generally indicate engagement from people who may not have known about you yet).
A spike in a particular social media channel can lead you to see a particular article that’s gone somewhat viral, and you may want to produce more of what made that happen. A change in your social media mix may indicate it’s time to focus on the channels that perform better.
‘Need help setting up goals in Google Analytics?
Click here to read Google Analytics Goals: How to Track Stats You Actually Care About.
How does the dashboard track interest?
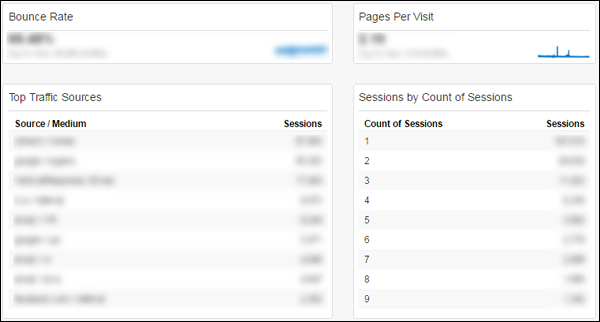
For interest, and to a degree, desire, you want to know a few key stats:
- Bounce rate helps you check if, month over month, more people are engaging with your site
- Source/medium helps you check if the mix of your traffic has remained the same, or if things like organic traffic (search engines) drive more of your traffic
- Pages per visit, like bounce rate, helps you check how engaged your visitors are
- Count of sessions helps with your retention and loyalty – it helps you determine how many people become loyal followers of your site
You can gather each of these individually from separate locations within GA. But it helps to see them together and make all of them accessible a click away under dashboards.
Got it. Anything else I should know?
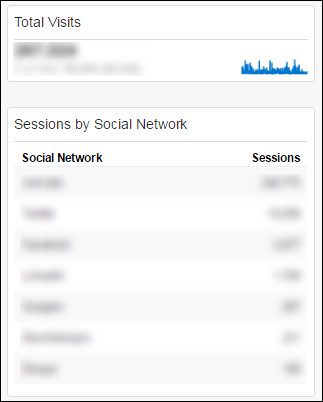
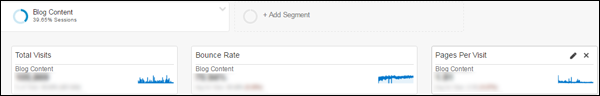
Once you’ve set up a dashboard under GA, you can make it even more useful by layering it with an advanced segment. So if you have an advanced segment for, say, just visits to your blog, you can apply that to the dashboard you’ve just created:
Getting Dashboards Right
When you do have to make dashboards for month-over-month or year-over-year comparisons, it helps to make them actionable.
If you use attention stats like total visits and social media traffic, and interest stats like bounce rate and count of sessions, you’re going to be spending less time analyzing statistics, and more time finding actual insights.