![]()
In the late 90s, marketers who dabbled with web site marketing had a few things they kept track of.
- Hits – the number of times an element (like an image) gets loaded
- Views – the number of times pages get loaded for a visitor
- Visits – the number of sessions a site has with visitors
Hits are just bad. The number of times your image or script gets loaded has nothing to do with how successful your web site is. (Later, it earned the acronym HITS, which stands for “How Idiots Track Success.”)
Views and visits, some of the only things you could reasonably track back then, fared better. But they’re still not indicative of overall online marketing success.
The problem is, a lot of marketers never moved on from views and visits – essentially tracking web site success like it’s 1998. If views and visits are still some of your biggest metrics (or worse, ONLY metrics) then it’s time for a 2016 overhaul.
It starts with a model – AIDA, or Attention, Interest, Desire, and Action.

Let’s dive in.
Attention
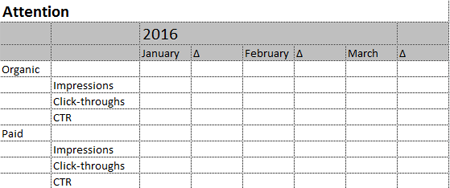
Attention encompasses the experience for people who are looking for something, but may not have heard about your brand. The key here is to understand how many new people get exposed to your site, how many people actually click-through to your site, and what the drop-off rates are.
As a lot of what comprises modern web traffic tends to be traffic from search engines. Here’s what you can start to track under attention:
- Impressions – the total number of people who typed in something on, say, Google, and saw a result for a page on your site
- Click-throughs – the number of people who clicked through to a result on your site
- Click-through Rate or CTR – the drop-off rates from impressions to click-throughs
Here’s what your dashboard can look like:
From there, you’ll be able to see where your biggest successes and failures are.
Maybe you have too few impressions, and you need to improve the content and backlinks on your site. Maybe you have a ton of impressions, but your titles are keeping users from clicking through.
Once you have a dashboard set up, you can focus on what’s broken from an attention standpoint.
Interest
After the attention phase comes interest.
Interest represents the people who are already looking at your site. You need to prove that you might have what they need, so they don’t immediately leave.
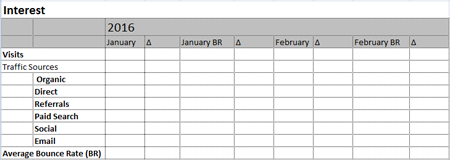
You need to look at the total traffic you have, the sources of your traffic, and the percentage of people who leave without doing anything:
- Visits – the number of sessions a site has with visitors, and your representation for overall traffic
- Traffic Sources – search engines (organic and paid), referrals from other sites, and other areas where your visitors come from
- Bounce Rate (BR) – the percentage of people who land on your site, don’t click on anything, and then leave (you want to bring this number down, not up)
Here’s what your dashboard can look like:
Once you have the figures for interest, you can …
- tweak your strategy to increase spending for traffic sources that have high engagement,
- focus on improving engagement for weak channels, and
- refine the experience for people who are already starting to get to know your site.
Desire
The desire phase is for people who are already somewhat familiar with your site. Reaching this phase means you’ve made the visitor feel safe and appreciated.
To know how big this group is, and to home in on what visitors want, you’ll need to track a few things:
- Returning Visitors – this is the number of people who are not first time visitors
- On-Site Search – this is the number of people who are confident enough that they can find what they need on your site that they conduct an internal search. You’ll want to break down the stats further than just the totals
- Searches – this is the total number of on-site searches conducted on your site
- % Search Exits – this number represents failures – people who exit your search results page without clicking on anything
- % Search Refinements – this figure represents people who try new searches in case their first one doesn’t result to what they need
Your dashboard will look like this:
From there, you’ll be able to figure out if your overall “loyal” users are increasing or decreasing, and how effective you are at providing specific information.
If the % search exits figure is high, you can look at specific searches and see where people are failing. If the returning visitor count is too low, you can look at your channels and see which one is not delivering.
Action(s)
Actions are a little tricky because they vary quite a bit depending on what type of site you have. Still, the actions people take on your site typically tend to fall on variations of these metrics:
- Educational PDF Downloads – if you have a key piece of literature that converts passive visitors into a potential customer, you need to track those PDFs as conversion actions
- Trial Downloads – trials represent enough of an effort on the user’s part that this can be considered at or near the bottom of the sales funnel
- Form Visits – your key forms pages should be tracked separately from the rest of your page views, as they represent people who are at or near the action phase
- Form Submissions (leads) – leads from form submissions is a great bottom-of-the-funnel metric
- Sales ($) – if you have an eCommerce site, you can’t go wrong with actual sales (sometimes tracked as page value of the “thank you” page after the checkout)
Your dashboard will look like a variation of this:
From there, you’ll be able to see what’s working and what’s not working at the bottom of the funnel, and start to hunt for the reasons why an area is not working.
Putting it All Together
If you’re tracking the right things, you’ll be tweaking the right things. There are no two ways about it – very few sites are testing and editing the right parts of the site because they are just THAT lucky.
Thankfully, it’s not hard to look at the right things, even for 2016 metrics. Tools like Google Analytics and Google Search Console can cover most of the metrics we’ve covered here.
Now, you just need the discipline to track these regularly, and use the data to prioritize.


