Thinking of trying out a heat mapping technology?
Before you do, make sure you know which heat map will work best for your objectives. You don’t want to be among the many who’ve failed at heat mapping because they didn’t fully understand the technology.
Heat maps may all look the same, but they’re not created equal.
To get the most out of heat maps, you should know how and when to use each type.
Below we describe the different types of heat mapping technology and the pros and cons of using each one.
The Different Types of Heat Maps and their Uses
1. Eye Tracking Heat Maps
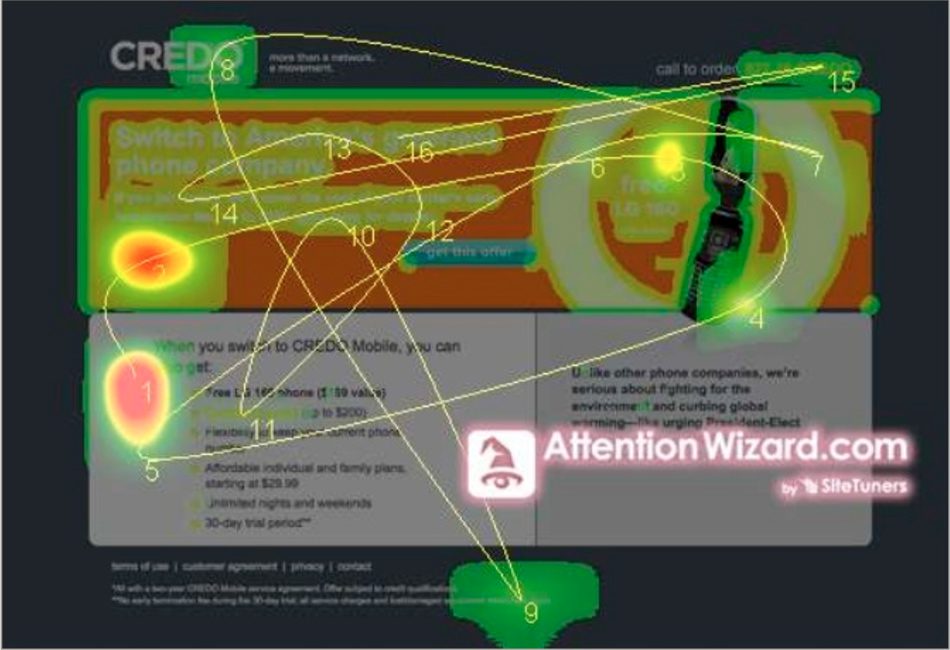
Eye tracking technology is the highest bar in visual analysis.
It’s fast and it delivers precise information on eye focus and motion while an individual is viewing a web page.
During an eye tracking study, data on the web user’s eye activity is collected using an eye tracker, which can either be a head-mounted eyepiece or a webcam. The eye tracker detects eye rotation, direction of gaze, blink patterns and stimuli responses.
![]()
The results from data analysis provides useful information on which web elements capture user attention, where they fixate on, and what’s the most visually interesting aspect of your page for users.
Eye Tracking PROS: Eye tracking is the most powerful visual analysis tool since humans pay attention to something by looking directly at it. By tracking the eye and its movements, you get more precise results and therefore better insights on user attention and interest on your web page than can be gained from proxy indicators such as clicks and mouse movements.
Eye tracking is especially useful during prototype and mock-up testing since it doesn’t require a live and fully functional site. So you can use eye tracking to study images of potential designs to find out which does a better job in terms of visual affordance as well as engaging and directing users’ visual attention to the right places.
Eye Tracking CONS: Eye tracking is the gold standard, which also means it usually comes with a hefty price tag. So if you’re going to spend on eye tracking technology, make sure it will be worthwhile. There are complaints, for instance, that eye tracking is characterized by diminishing returns, wherein you need to keep paying for it even if it’s no longer proving to be useful to you and the company.
Invest only in eye tracking if you’re sure you’ll get a lot of insight compared to the costs you’ll incur. For instance, eye tracking isn’t very cost-effective when you’re trying to improve usability or user experience on a new website. A traditional usability or UX research is easier and cheaper in this case.
2. Mouse Tracking Heat Maps
Mouse tracking heat maps reveal user interaction on your web page by tracking cursor or mouse movements such as hovers, scrolls, and clicks.
There are three kinds of mouse tracking heat maps: Click Maps, Hover or Attention Maps, and Scroll Maps.
A. Click Maps
A click map shows you where people click on your website. This helps you learn not only which buttons or links draw the most clicks, but also which non-clickable items are consistently mistaken to be otherwise.
Hence, click maps are highly useful in uncovering usability flaws. Click map data can show you the web elements that confuse visitors while navigating your web site. Once you know which non-clickable images or text your users are clicking on, you can easily fix the problem according to user expectations.
Another common use for click maps is for checking form fill drop-offs. By learning where people usually leave the uncompleted form, you’ll have a basis for changing form design and fields to increase conversions.
B. Hover Maps/Attention Maps
A hover or attention map shows you the web page areas where users lingered most with their mouse cursors.
Hover maps draw from the principles of eye tracking but replaces eye movements with mouse cursor movements. Here, hovering behavior is used as a proxy indicator for people’s attention. Put simply, hover maps assume that people look where their cursors are.
But it is precisely this assumption of correlation that makes hover map results dubious. User experience experts like Google’s Dr. Anne Aula, for instance, have found that the correlation between cursor movement and attention is exhibited only by a small percentage of web users.
This makes sense, as people on the web may park their mouse somewhere and yet may be looking elsewhere. There’s really no way of knowing whether their eyes and cursors are on the same spot – unless you use eye tracking.
C. Scroll Maps
Scroll maps reveal how far web users scroll down a page. They show you how many visitors reach the middle or bottom of the page and where they leave.

This information provides important insight not only on how long your page should be but also where essential elements such as CTA buttons should be located. Scroll map data can also guide you with your design and content strategy. If visitors are bouncing early, for instance, you might want to check if your page contains relevant content, inspires trust, or is engaging enough to maintain visitor interest.
Mouse Tracking PROS: A clear advantage of using mouse tracking heat maps is their lower cost compared to eye tracking technology. So they’re a cheaper alternative if you only need data on user clicks or scrolling behavior.
Mouse Tracking CONS: Mouse tracking is affordable but it’s not without its downsides. First, it requires you to have a large traffic to draw reliable conclusions. This also means that mouse movement tracking isn’t a wise choice of tool when you’re trying to assess an initial design or are planning for possible content or design changes. You need live web pages and enough sample size to get useful insights.
More importantly, clicks and mouse movement are poor proxies for eye tracking given the weak correlation between attention and mouse cursor activity. So you should be careful not to draw over-generalizations especially from hover maps.
3. Software Algorithm Heat Maps
Last but not the least are the heat map tools that utilize an algorithm in analyzing your pages. These tools generate visual data by predicting user attention on a web page based on its design elements and attributes.
Software algorithm heat maps can provide you with instant feedback on possible common usability or user experience issues that actual users might encounter.
Software Algorithm PROS: Algorithm-based heat maps can be used even if you don’t have large traffic volumes. Also, they’re usually faster and cheaper.
Software Algorithm CONS: Of course, data generated from software algorithm is often less accurate compared to tracking that involves human users. While algorithms may be able to recognize facial expressions within images, for instance, they will always fall short in identifying the kind of emotions evoked by the combination of language and imagery within a web page.
Getting Value from Heat Maps
Clearly, visual analysis tools like heat maps can provide digital marketers with crucial knowledge on user behavior and attention on a web page. This can help digital marketers improve the usability and user experience of their websites by tailoring the according to visitor activity.
Like all tools out there, heat mapping comes at a cost, whether in time, money, or opportunity. But it is an important step towards data-driven and conversion-centric design, which, over time, can significantly boost your ROI.