Improve Your Website Using the AIDA Model
The AIDA model was developed in 1898 by E. St. Elmo Lewis, mostly for selling in person. Use of AIDA in marketing today’s websites is still extremely beneficial.
Understanding the stages of your visitors buying cycles
AIDA’s Process
The core process of the AIDA model remains relevant today:
- Attention. Make the potential consumer aware of the brand or product, by having something like an advertisement be surprising or attention-grabbing.
- Interest. Get the potential customers to be interested in learning about the benefits of the product, and how the product is right for them.
- Desire. Move the potential consumer’s sentiment towards liking the brand.
- Action. Get the potential customers in a buying mood for the product, or directly sell them something.
So, for instance, in the attract phase, capitalized first words are used to start a sentence, surprising images are used, and so on.

This old Chesterfield ad tries to capture the audience’s attention by capitalizing all the letters of the first three words of the paragraph.
Once the user’s attention is on the ad or material, the rest of the phases can follow.
Apply AIDA to Your Digital Marketing
Given the relative applicability of that process to anything from ads to direct selling.
- Attention. Make the potential consumer aware of the brand or product.
- Interest. Get the potential customers to be interested in learning about the benefits of the product, and how the product is right for them.
- Desire. Move the potential consumer’s sentiment towards liking the brand.
- Action. Get the potential customers in a buying mood for the product.
Direct selling and ads lent themselves to basic observations, but there was not a ton data for marketers to observe after the strategy had been deployed. It wasn’t until much, much later when the model was applied to data-friendly fields that measurements for each of those phases became sophisticated.
As AIDA became an organizing tool for data-rich environments, the approach became popular for creating better websites.
Attention
The scarcity of user attention needs to be something all organizations are cognizant of, given the massive number of websites that users can conduct research on.
For websites, there are a few fundamental rules to follow:
- If a visitor can’t find something on the site, it basically doesn’t exist.
- Giving equal visual importance to all your elements will make the items users need the most less emphasized than they need to be.
- Users have the patience of a lit match; any delay will tend to cause frustration.
This is why when you’re competing with others for user attention, page speed and visual prioritization are two of the most critical things to think of.
Page speed is something that you can generally influence and has a big payoff. In their research, Portent found that websites with a 1 second page load enjoyed 3x higher conversion rates than websites with 5 second page loading speeds.
You can use techniques like minifying javascript and applying srcset to images to make page load times more bearable for your audience. It is critical in all the phases, but especially so in the attention phase, when you have no clout with the potential customer yet.
Visual prioritization is something you should actively think about, so when the user lands on a property, they don’t immediately leave. Readers will generally move from top to bottom, from left to right, following the F pattern for reading. You can use this to think about what drove their attention your way, and then ensure that you lose as little of the audience as possible in this phase.
Measurement in the Attention Phase
There are multiple paid and free techniques to grab attention and get people on your site.
Track all the channels that drive a significant number of visitors to your site:
- Organic traffic. Year over year growth of free search engine traffic should be one of the company’s standard metrics.
- Paid search engine traffic. You should measure paid search engine traffic impressions, click-throughs, and the click-through rate.
- Social media views. Reach for social media is attention. But for this kind of attention, you shouldn’t freak out if the user doesn’t interact as much when compared to, say, a landing page for Google Ads.
- Social media referrals. Referrals to the website from sites like Facebook should be viewed with a different lens compared to, say, organic traffic. Overall growth should still be monitored, however.
- Display ads. Just like with search engine traffic, you should be tracking growth of impressions, click-throughs, and click-through rate.
The starting point of your dashboard can look like this:

From there, you’ll be able to see where your biggest attention successes and failures are.
- If you have a problem with impressions, you can fix the content and backlinks to try and fix the issue.
- If you have a ton of impressions but not enough click-throughs, you can try and fix the browser page titles to try and get more users to click through.
Having a measurement plan for the attention phase can help you drive more people to the site.
Interest
For websites, the interest phase is about knowing and respecting what the user wants. Just like with the attention phase, this comes with a few basic guidelines:
- Know who your visitors are.
- Understand what they are trying to accomplish.
If you have existing data for roles and tasks, that will come in handy.
If you have qualitative software that can ask users what they need, like Qualtrics or iPerceptions, the results will help you understand what the user tasks are and arrange the site according to actions for those tasks.
For your audience, you can use tools like Google Analytics to learn more about the demographics.
When you combine demographics information with task information, you can keep visitors engaged enough to be interested in your products.
Measurement in the Interest Phase
In the interest phase, you need to measure the overall engagement on the website. That’s a combination of the visits and the bounce rate by traffic source.
- Visits. This is the number of sessions visitors have on the site, and this is a proxy for the site’s overall traffic.
- Traffic sources. Search engines, display traffic, referrals from other sites, and other areas your traffic can come from.
- Bounce Rate (BR). The percentage of people who land on your site, don’t click on anything, and then leave. The higher this number, the lower your engagement, so you generally want to bring this number down.
Your starting point can look like this:

Once you have collected data about the interest phase, you can adjust a few things on the site:
- You can spend more on traffic that generally has high engagement, and reduce ad spend on low engagement traffic sources.
- You can start to review the traffic sources that send you low engagement traffic, and then try and improve the bounce rate for those areas.
Improving your measurement game for the interest phase can help you retain visitors until they want to do business with you.
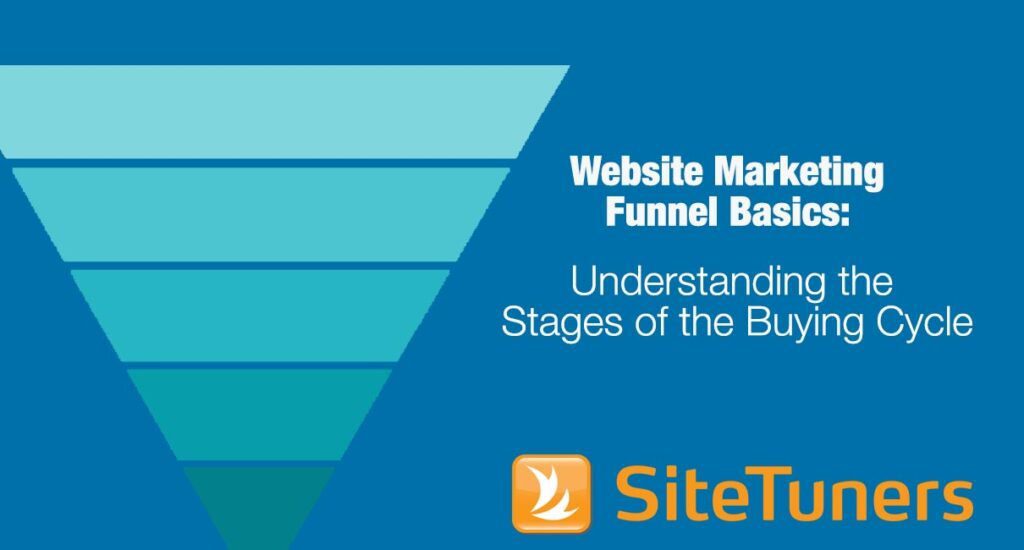
Learn how to move from a general AIDA framework to a more specific website-oriented marketing funnel.
Read “Website Marketing Funnel Basics: Understanding the Stages of the Buying Cycle”
Desire
Once you get past the first two stages, you need to ensure a few things happen:
- Make the visitor feel appreciated.
- Make the visitor feel safe.
- Give the visitor agency.
The visitor needs to feel in control of the overall experience. You need to provide information that makes the visitor feel appreciated. You can provide things like research files, comparison tools, and other things that can help the user find what they need.
If you can convince the visitors that you have what they need, and that they can transact with you without risks, you can win more during this phase.
Measurement in the Desire Phase
It can be tricky to measure the size of the audience in the desire phase. You’ll want to track a few different things:
- Returning visitors. This is the number of people who are not first time visitors. It can serve as an indicator for the size of the audience who are progressing through the customer journey.
- On-site search. This is the number of people who are confident enough that they can find what they need on your site that they conduct an internal search.
- Searches. This is the total number of on-site searches conducted on your site.
- % Search Exits. This number represents failures. These are people who exit your search results page without clicking on anything.
- % Search Refinements. This figure represents people who try new searches in case their first one doesn’t result to what they need.
This can be the starting point for your dashboard:

You can adjust the pages people return to try and get higher engagement. You need to ensure you’re tracking the on-site search terms people use.
On top of this, you should use featured results when your handcrafted picks are likely to be better than algorithm-picked ones from your engine, at least for the top 200 searches or so.
Ensuring your desire phase game is on point will help you drive more people to the action phase, and give you a higher chance to convert visitors into customers.
Action
After you convince visitors you have what they want, the next task is to convince them to transact with you. This is not an easy task – consumers are getting increasingly savvy, and the median online purchase times for many industries are steadily increasing because of comparison shopping.
It’s possible to overcome those challenges, but you have to follow best practices:
- Get out of the visitor’s way.
- Make it easy for the visitor to pull the trigger by having a distraction-free cart or form.
- Do not surprise the visitor.
The best thing you can do at this stage is to put an easy to pull trigger in front of a motivated visitor, and then get out of the way.
Measurement in the Action Phase
Actions can vary quite a bit depending on the website’s goals. You need to ensure that the core goals of the website are tracked and optimized:
- PDF downloads. If you have certain pieces of literature that convert visitors into a potential customer, you need to track those PDFs as conversion actions.
- Trial downloads. Trials represent enough of an effort on the user’s part that taking them indicates the users are near the bottom of the funnel.
- Form visits. You should track the number of times your key forms get visited, as that indicates the number of people who are near the action phase.
- Form submissions (leads). Leads from form submissions represent bottom of the funnel success. You should pair tracking for this with the tracking for form visits to see the drop-off rate.
- Sales ($). For e-commerce sites, you can assign page values to particular thank-you pages and get the actual sales values.
If your main conversion points are trials and form submissions, your actions dashboard can look something like this:

For sales-oriented websites, you’ll be tracking cart visits and sales instead of downloads, form visits, and form submissions. However, monitoring the monthly conversions will still look the same. The idea is still to look at the weakest areas where you have a ton of drop-offs, and plug the leaky parts of the bucket.
Advantages of using the AIDA Model
If you have not been using any model or framework to track success, AIDA is a great way to structure how you think about the user experience and data points on your website.
In fact, the AIDA model is pretty useful when you’re beginning to create a customer journey map.
By thinking about what you want to achieve depending on the phase of the journey, you avoid the trap of trying to boil the ocean. You can identify what you’re trying to achieve depending on the stage of the journey, isolate that, and work on improving just that part of the experience.
By tracking each phase of the journey, you’ll be able to see which parts deliver strong returns and properly transition most visitors into the next phase.
This also tells you which parts tend to fail. By understanding which parts of the site are broken, you’ll can prioritize and devote most of your resources to things that are likely to move the needle.
AIDA Marketing Funnel Limitations and Criticism
The longevity of AIDA in marketing is a testament to its usefulness as a model.
However, the AIDA model is over a hundred years old. There are things that it will not be useful for in today’s environment.
Multiple transactions
For one thing, AIDA covers the point from the time a person might be interested to the time when the check clears. There’s nothing in there about what happens after the first transaction. For some businesses, repeat business and customer lifetime value are more important to think about than single purchases.
If you have a business that relies on repeat customers, you need to augment the AIDA model with a framework that takes customer lifetime value into account.
Satisfaction and branding
Another thing that AIDA does not cover is reputation management. There are things that should be on your radar that AIDA ignores:
- Visitor satisfaction/dissatisfaction with the products
- Recommendations and user reviews
- Brand loyalty
For most businesses, these are things that should absolutely be monitored. And issues that arise from these areas should absolutely be addressed.
If you’re using AIDA, you should have a separate monitoring plan for these areas.
Conclusion: Maximizing the AIDA Model
AIDA is a powerful framework that has been in use for a very long time.
For websites, using the AIDA approach can be a boon to how you think about and monitor conversions. By thinking about the different goals depending on where the visitors are in their journey, you’ll be able to isolate the parts you need to monitor, and improve the weakest areas.
If you plan to use AIDA, you need to closely monitor the different key performance indicators for each stage of the site, track them by set intervals, and see if the changes you’re making are improving the site.
To maximize AIDA model use, though, you need to understand what it does well, and what it doesn’t. If you use the framework, you’d still need something else to monitor things like customer lifetime value and satisfaction.
If you understand AIDA well enough to understand its benefits and pitfalls, you’ll be able to use it to effectively monitor and improve your website.